We’re at an interesting juncture when it comes to the UK consumer outlook. Much has been written on the cost-of-living crisis, no doubt worsened by the ongoing war in Ukraine, and our reliance on gas. Just to put this into perspective, the IMF recently predicted the UK economy would perform even worse than Russia’s in 2023. Brexit still seems the elephant in the room, not even mentioned in analyses like the above.
That said, we have also seen oil and gas prices return to more normal levels – in what is surely a sign of things to come, in March, Ovo offered the first 12 month energy tariff that UK households had seen for quite some time.
With all of this in mind, we have gathered both original and third-party research into how the economy is affecting UK parents in particular – and collated the insights below to help you understand some of the opportunities and challenges that may lie ahead.
The first set of data comes from a survey of 532 parents surveyed in Jan 2023, produced in conjunction with our partner Peekator:
Cost of Living – Overall Impact
Single parents have been hardest hit by the cost-of-living crisis, with more than half (52%) saying the economy has had ‘a significant impact on their life and finances.’ The contrast is quite sharp with almost the same number (49%) of dual income parents saying it has only ‘slightly impacted them.’
Even if the gravity of cost-of-living’s impact is uneven, most have been affected to some degree. Two-thirds of parents (66%) overall say they have cut back on spending to combat the rising cost of living, and 55% saying they are trying to save when and where they can.
Spending
We’ve written separately on cost of living’s impact on travel, explaining how and why ‘holidays are a non-negotiable purchase.’ So, even if those trips may be cheaper, their overall number doesn’t seem to have reduced.
The only question remains, where else are parents making savings? For two-thirds (67%), it’s in eating out, and for slightly fewer, entertainment and luxuries (60% and 59% respectively). Interestingly, among the highest earners, mothers are more likely to cut back on eating out (72%), while for fathers, luxuries top the list (66%).
When it comes to spending on children, 41% understandably say they have spent less on gifts year-on-year. It is also notable however that 20% have, despite cost pressures, still spent more. Could this be because of inflation, as parents try to offer children the same as before? Or are a fifth of parents actively prioritising gifts at the expense of other spending?
On a slightly more positive note, in terms of business, more than a third (36%) of parents are planning to purchase home and furniture items, choosing to budget their income for large purchases. However, when considering financial products, only 11% of respondents said they expect to buy financial products such as stocks and shares – possibly reflecting either the growth of alternative forms of investment, or simply that parents don’t have the money to put into savings.
67% of parents say that they have some cash or savings put away for emergencies, also down, 4% on 2021. On a more positive note, the number of parents with a pension was up 4% over the same period, reaching a total of 47% of the overall group. Finally, parents are 25% more likely to have annuity investments such as mortgage, insurance or pension payments compared to the general UK population.
Automotive

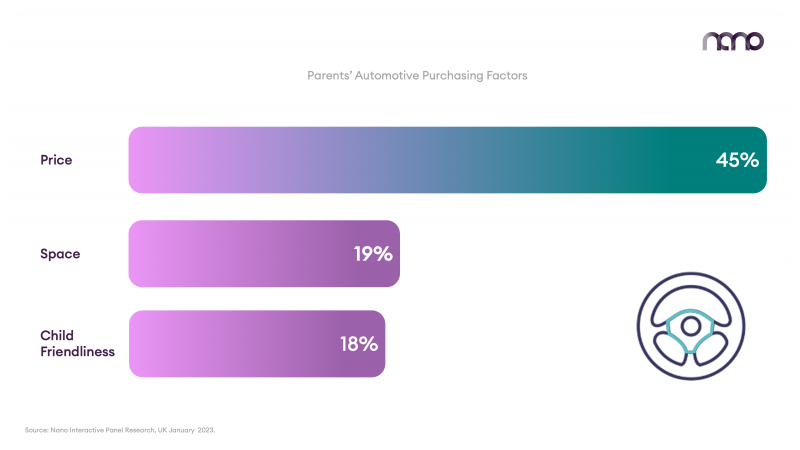
Almost half of parents (45%) say that price is the biggest factor they consider when purchasing a car, with only 19% by comparison choosing space inside the car, and a similar number (18%) picking child-friendliness.
When it comes to single parents, dads put more emphasis on price as a primary consideration (56%), while for mums the same option scored under 50%.
Perhaps unsurprisingly, single dads favour technology – with 14% selecting it as a priority, second only to pricing. Single mums chose space inside the car as their second favourite option (15%).
To give a general idea of the ownership of the respondents, more than a quarter (26%) were Ford owners, 15% owned Audis, and a similar number (14%) said they own a Nissan.
By having a deeper understanding of intents in which parents overindex in and their purchasing habits, we’re able to intercept the right live intents at the right time.


